
Have you ever truly evaluated your Lands of America advertising with real analytics? You can now …
It’s that time of year when brokerages are evaluating their marketing spend and performance. Lands of America advertising performance will certainly be one of the top segments evaluated in a brokers marketing mix.
For many brokers, just being online is enough. But with today’s online buyers doing months of research and monitoring for land listings and brokerages, the online presentation (merchandising) is the critical starting point for a buyer.
Lands of America works for a lot of brokers and agents, but critically evaluating the data and how you merchandise property on this network of sites can result in thousands of dollars in new found money. In this article we are going give you key analysis techniques and data points to evaluate Lands of America advertising and better yet tips to improve your brokerage merchandising of land listings on Lands of America.
Lands of America Advertising Analytics
 Like most online classified websites, Lands of America provides some basic analytics for your land listing performance on their site. They provide some simple metrics such as Searches, Views, and each of these data points over time with a line chart. Ok, great, but really how do I evaluate performance of my brokerage or individual listing?
If you get 10,000 searches on a listing …is that good? What if you get 1,200 views …is that good?
These are good for showing sellers that they are getting online activity on their listing, but individually they really don’t demonstrate much in the way of results in most cases. Now, if we compile some of these data points we’ll get incredible performance insight as to how your listings are performing against others by calculating averages, rank, and per day analysis.
Let’s unpack this data to better assess its performance.
I’ll start by explaining that when a visitor searches LandsofAmerica.com and listings display on screen, the default sort is price highest to lowest. This inflate your “Searches” total. You see, if your are one of the largest acreage listings for a particular county then it is very likely that you are one of the highest total price listings. That means you are by default at the top or near the top of the list. Also, if you are in a county that has very few listings then it is more likely that you’ll be page 1 or at the top.
The important point here is you want to be on page 1 of typical searches you believe the buyer will perform. There are countless articles and research to support that being on page 1 of a search result is critical. We’ll save this topic for another article.
Being at the top of the list has value no doubt, but I just want to be clear that it inflates your “Searches” data point for this listing. Searches (for Lands of America) is the quantity of times a listing appears in a visitors search results. A Searches rate on LandsofAmerica.com can vary widely because of demand or popularity within certain counties and as already mentioned being one of the top ranked in total asking price.
So overall, Searches on its own for individual listings isn’t much of a value …which brings us to combining it with the next data point to create a real meaningful Key Performance Indicator (KPI).
Lands of America uses the word “Views” to mean the number of times a listing is clicked aka viewed. This is pretty simple, Listing A appears in the Search Result and a buyer clicks on Listing A. That click counts as a “View”.
As with Searches, Views are generally interesting, but as a single data point not very insightful because it can vary by thousands based on days on market, county demand, and total price rank. Check out #1 below for a better performance indicator.
Ok, time to really pay attention!! Here is the important metrics of four key performance indicators.
4 Key Performance Indicators for Lands of America Advertising

1. Click Through Rate (CTR) – this is number of views divided by number of searches to give us a percentage rate that site visitors click on a listing.
Based on general marketing click through rates, a good CTR average should be 3-5%. There are several factors that play into your CTR though. Consider your marquee photo displayed, did you use video, or is your written copy compelling?
So evaluating yourself and your brokerage here is key. Spend some time critiquing your own listings compared to others in your market. The best performing listings have professional photos with professional color enhancement or display video as marquee photo, and have compelling intro sentence about the listing.
Which listing would you click on?
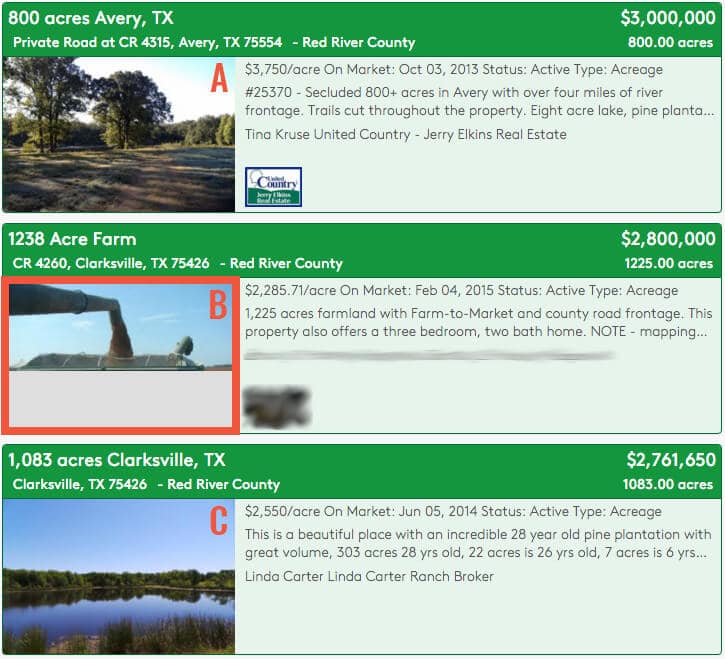
Actually the question is which one would you NOT click on …B! You are asking the full market prices and $2.8M, but you can’t even get the photos done well. So B is obvious, but lets critique A & C. Photo A is ok, but it really doesn’t sell me any value. It is shadowy, the road really just looks like a worn path, and trees don’t lend to picturesque scene. Every ranch has a scene like this one pictured, but surely there is a better scene somewhere else on property …you have 800 acres to pick from. I don’t know this for fact but I bet the agent took this photo or unqualified photographer.
Now take in photo C. The tree line is perfect horizontal centered, the water feature is clearly large, sky is awesome blue bird day, reflection on the water is enchanting, water totally calm, and there is fish habitat on the shoreline …ok, I’m interested …click.
Just for the exercise, read the description excerpts of each listing A, B, and C. Are you starting to see a better merchandised listing surface?
I took some description excerpts from other listings as well just to focus on my point. Here is a comparison of example written copy:
- 560 Acres WKL RANCH, BLANCO COUNTY 181 Pape Lane, Blanco, Texas 78606 DESCRIPTION: Conveniently located just 2 miles west of the town of …
- Spectacular acreage tract just west of Blanco. Gorgeous spring-fed creek and Pond on the property, along with incredible views in all directions
I’d go with listing #2. It is more intriguing to get me to click with talk of spring-fed creek, a pond, and views. This excerpt is the first words you put into your description. Choose your words carefully and be persuasive to get the click …something advertising experts have been doing for decades.

2. Searches per Day – this is the most accurate way to compare listings in your portfolio. It takes out the “totals” and evens the comparison by accounting for days on market. Easy calculation is number of searches divided by days on market.
Your average searches per day should be between 100 and 200 per day on average.
The important assessment for your own listings is comparing it to your average. Download the REALSTACK spreadsheet for easy calculations here.

3. Views per Day – this is where it matters to a broker or agent. Again, we factor in days on market to give comparisons a common denominator. Simple calculation is total views divided by days on market.
In marketing, when a visitor clicks on a listing this is a behavior. A behavior in this case demonstrating that they are interested at some level. We don’t necessarily know where they are in their shopping process or marketing funnel but statistically it does help us gauge market interest. Most importantly, this data point helps us benchmark each listing against a consistent average.
Your average views per day should be between 5-9 per day. Although views per day can vary from brokerage to brokerage depending on your portfolio of listings. It is important to establish YOUR averages.
Download the REALSTACK spreadsheet for easy calculations here.

4. Leads per View – now we’re talking …leads, people who engage with your online listings. Just as views are a behavior, so are engagement. Engagement meaning a visitor to your listing inquires, shares, prints flyer, visits your website, or views your phone number. This is a slightly stronger behavior than a view right? Absolutely and as marketers we’d say they are moving down the marketing funnel and hopefully on their way into the sales funnel.
Leads per view is import metric because we must understand why people are engaging more or less than other listings. To calculate, take number of leads divided by number of views. This will give you a percentage of leads per view.
Your leads per view should be between 1% and 2%. Remember this is based on views total for a listing not searches.
Self assessing your marketing is a must-do activity that any business has to do. Land brokerages are no different. I encourage you in 2016 to make statistics and analytics part of your quarterly evaluation of the business and your portfolio of listings. Start simple and grow from there. Getting a baseline for averages will be the key starting point.
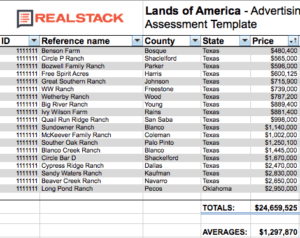
I’ve created a spreadsheet intended just for you to get started in the new year at evaluating your brokerage performance with Lands of America advertising. Get your download copy today and be on your way to better decisions and marketing practices with your land brokerage.
Click Download button to get your Lands of America Advertising Assessment template spreadsheet.

P.S. There are two other factors that directly impact your online marketing results …Price per Acre to Market (PPATM) and Price per Acre Rank (PPAR). Often times these can be the 2 most important factors for marketing results. People just don’t waste their time on overpriced land and if you are priced correctly at price per acre but in the top of total price then you’ll have to exercise some patience.
Definitions:
Searches – the quantity of times a particular listing appears in the search results.
Views – the quantity that a listing is clicked or viewed
Click through rate (CTR) – the ratio of times a listing appears in search result compared to number of times a listing is clicked. LDV / LSR = X%
Price per Acre to Market (PPATM) – percentage of a listing price per acre to the average price per acre for similar listings in that market.
Price per Acre Rank (PPAR) – numerical ranking of listings from highest overall price to lowest overall price.